Occidental Petroleum Corp. (NYSE:OXY) has had a troubled past, but has, since 2020, turned its business model around, with financial and operating results enjoying significant improvement. The firm remains a very good long-term bet, trading at attractive levels compared to the market and its peers.
Five Years of Trouble
In the last five years, Occidental has earned a total shareholder return (TSR) of nearly -3%. In that time, the S&P 500 has earned a TSR of nearly 55%. Occidental also trailed its peer group, whose market cap. weighted TSR was 39.2%. The peer group consists of BP plc (BP), Chevron Corp. (CVX), ConocoPhillips (COP), EOG Resources, Inc. (EOG), Exxon Mobil Corp. (XOM), Hess Corp. (HES), Marathon Petroleum Corp. (MPC), Phillips 66 (PSX), Pioneer Natural Resources Company (PXD), Shell plc (SHEL), TotalEnergies SE (TTE), and Valero Energy Corp. (VLO).
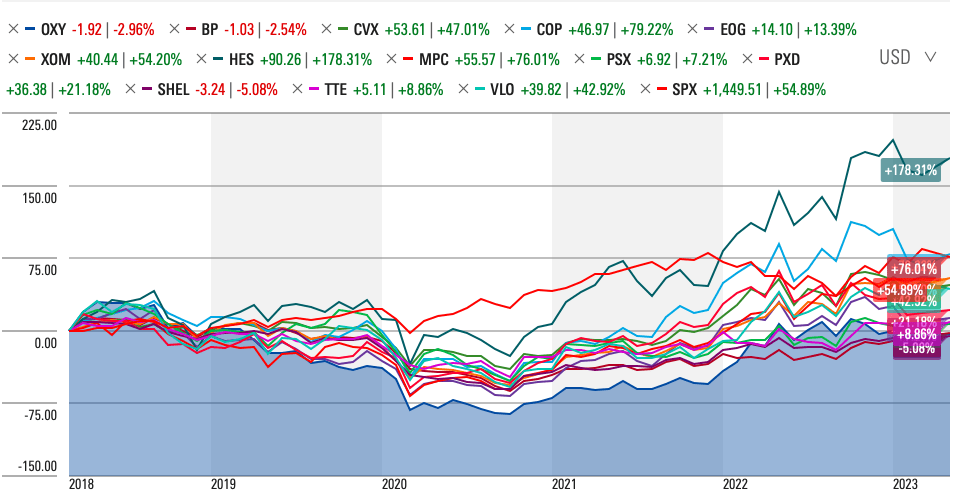
Source: Morningstar
The question for investors is whether the company has the qualities for long-term superior TSR over the next five-year period.
Incentives Align Shareholder and Management Interests
According to the company’s 2023 Proxy Statement, the executive compensation program, among other things, aims to align the interests of named executive officers (NEOs) with those of shareholders. Now, it is one of the few axioms of financial theory that value is created when a company earns a return on its investments greater than the cost of capital. Typically, companies who seek to resolve the principal-agent problem in businesses use return on invested capital (ROIC), given that it demonstrates how efficiently a business uses its capital to earn profits for its shareholders. However, there is a lot of merit in Occidental’s use of cash return to capital employed (CROCE). As an investor, what you should be really more interested in is a business’s repeatable ability to earn profits from the capital employed, more than its ability to earn acquisitive growth at a reasonable price. The firm’s performance share units (PSUs) are tied to both TSR and CROCE, to reward management for translating its results into shareholder returns, and for its capital efficiency and prudent capital allocation. The PSUs are 50% of the long-term incentive awards.
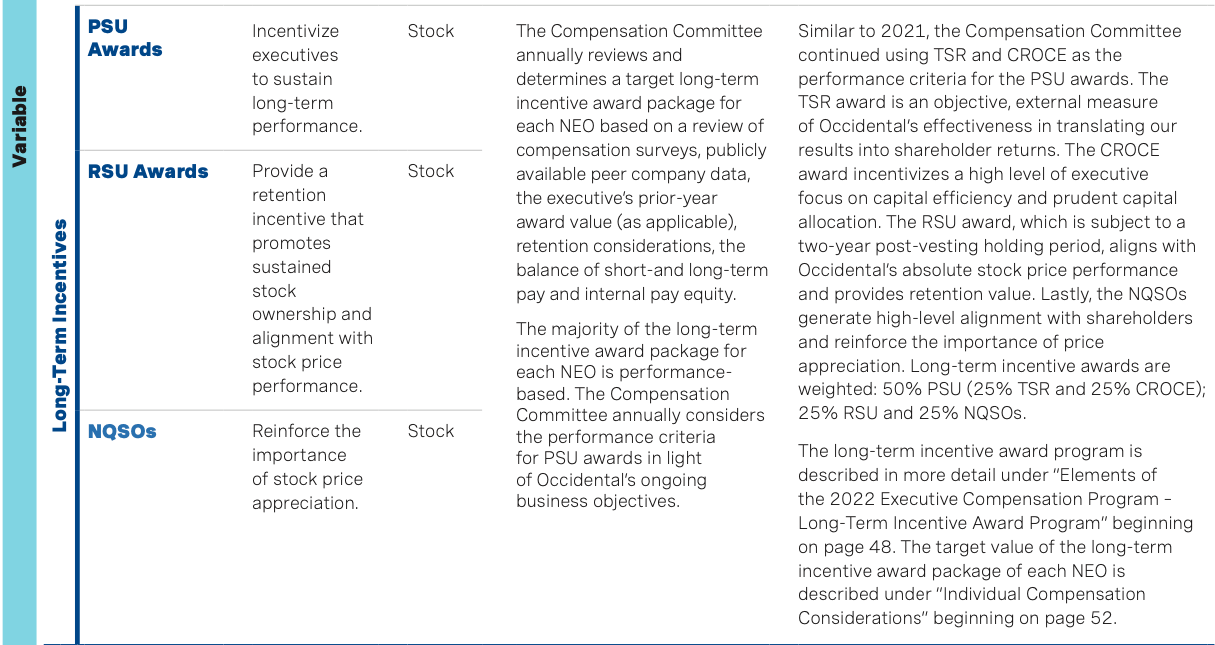
Source: 2023 Proxy Statement, Occidental Petroleum Corp.
In the 2020-2029 period, CROCE has risen from 9% to 36%, for a 3-year CROCE of 22.4%, compared to a threshold CROCE of 11%, and a target CROCE of 13%? The TSR for the period, although positive, ranked fifth out of its peer group.
Improving Capital Allocation
Occidental Petroleum has endured a series of well-publicized struggles in the last five years, and this is reflected in the deteriorating capital efficiency and profitability of the company between 2018 and 2020. However, since 2020, the company’s capital efficiency and capital allocation have improved, with CROCE rising from 9% to 36%, and ROIC rising from -13.4% to 17.5%.
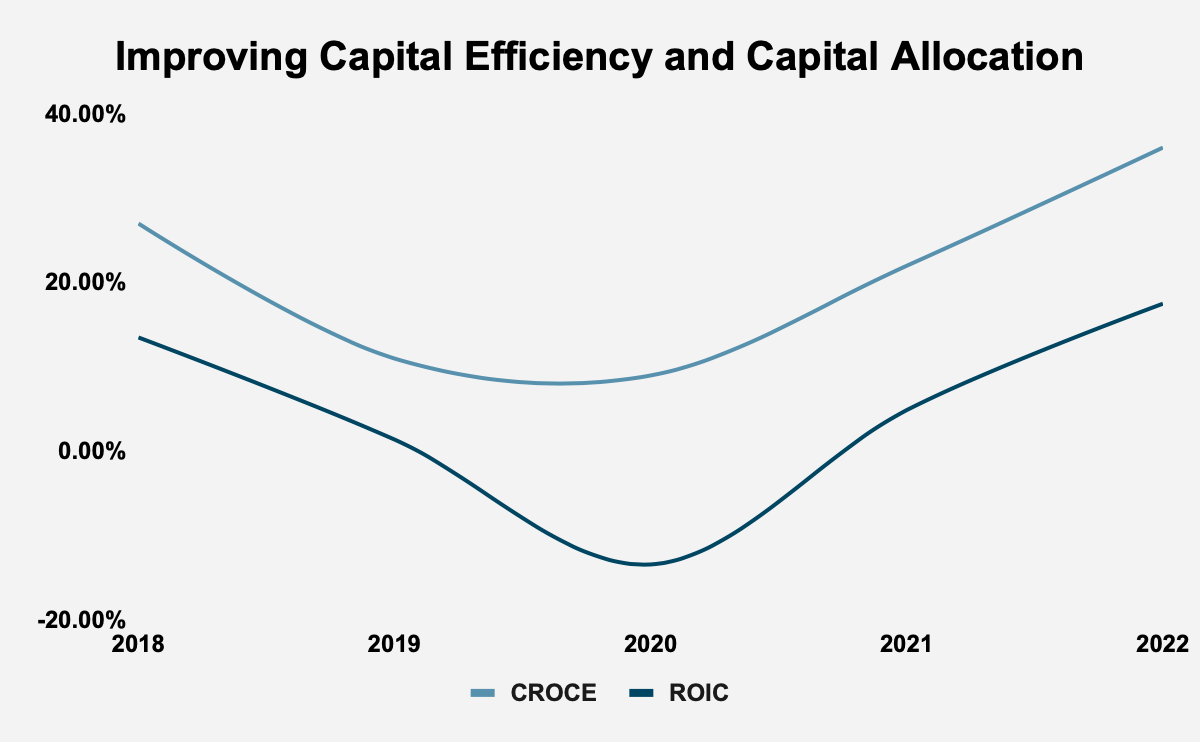
Source: Occidental Petroleum Corp. Company Filings
Given the correlation between a company’s returns and its future corporate value, it is not surprising that in the period since 2020, the company’s TSR has easily exceeded that of the S&P 500, with Occidental Petroleum achieving a TSR of over 285%, compared to a TSR of nearly 41% for the S&P 500.
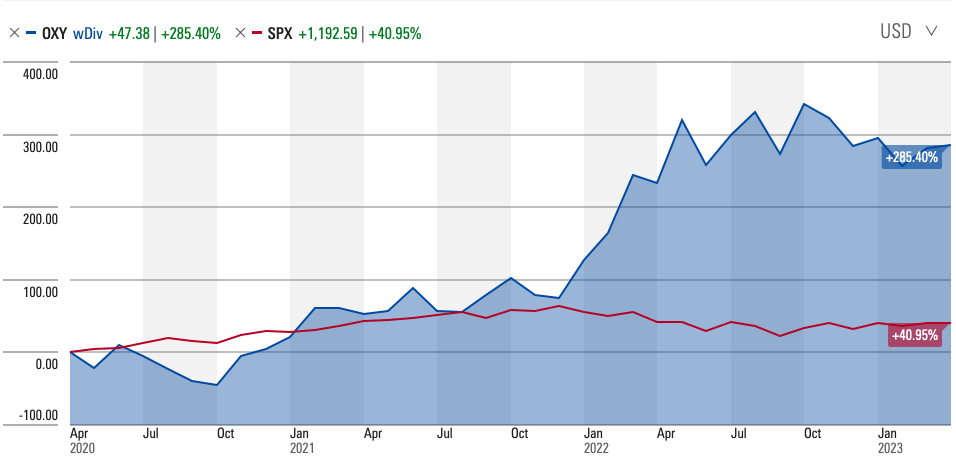
Source: Morningstar
The company’s improving capital efficiency and prudential capital allocation is a testament to president and chief executive officer (CEO), Vicki Hollub’s management. Indeed, no less an expert as Warren Buffett said that, “She’s running the company the right way”.
Profitable Growth
Revenue grew from $18.93 billion in 2018 to $37.1 billion in 2022, at a 5-year CAGR of 14.4%. According to Credit Suisse’s “The Base Rate Book”, 12.6% of firms in the 1950 to 2015 period achieved a 5-year sales CAGR of between 10% and 15%. The mean 5-year sales CAGR in that period was 6.9% and the median 5-year sales CAGR was 5.2%.
The company’s gross profits rose from $7.95 billion in 2018 to $16.56 billion, at a 5-year CAGR of 15.81%. Gross profitability, which scales gross profits with total assets, rose from 0.18 in 2018 to 0.22 in 2022. While it has risen, it is still below the 0.33 threshold that Robert Novy-Marx identified as a marker of a firm’s attractiveness. Occidental’s gross profitability also trails the market cap weighted average gross profitability of its peer group, which was 0.3 in 2022.
Occidental’s operating profit rose from $5.67 billion in 2018 to $14.04 billion in 2022, at a 5-year CAGR of 19.88%. The company’s operating margin rose from 29.93% in 2018 to 37.84% in 2022. In the 1950-2015 reference period, the mean operating margin was 11.6%, and the median operating margin was 12.1%.
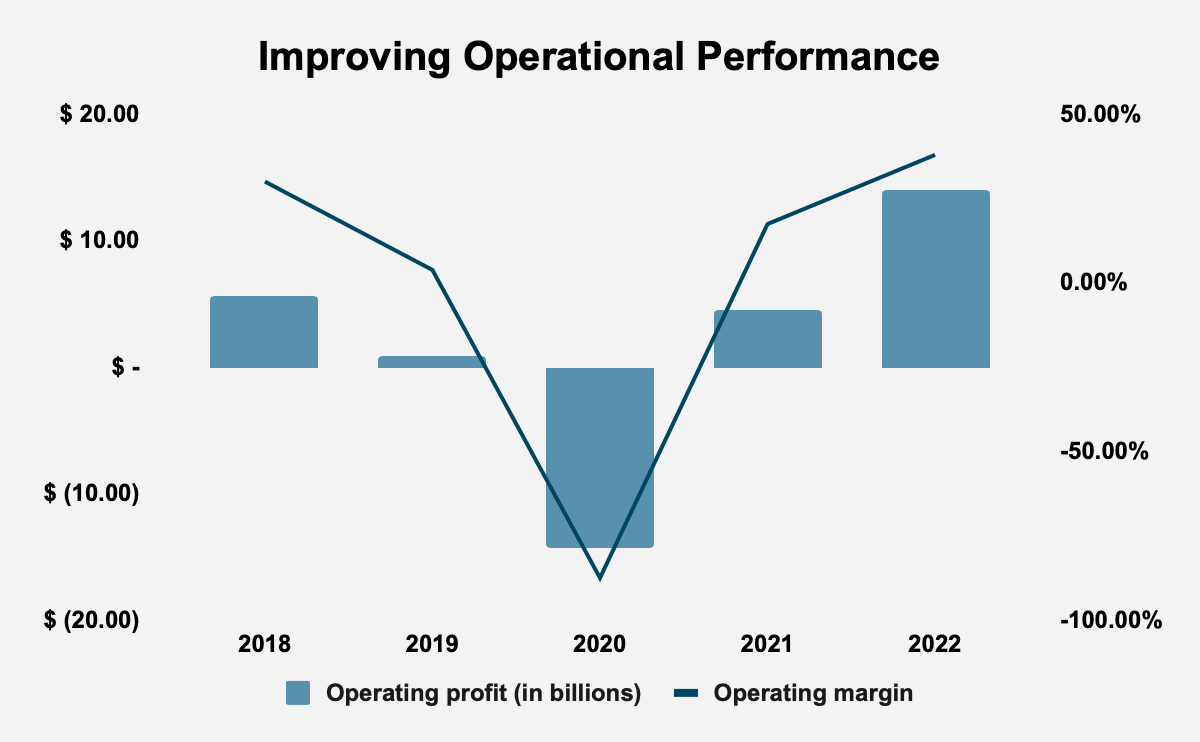
Source: Occidental Petroleum Corp. Company Filings
Earnings rose from $4.13 billion in 2018 to $13.3 billion in 2022, at a 5-year CAGR of 26.35%. In contrast, in our reference period, 8.8% of firms enjoyed a 5-year earnings CAGR of between 20% and 30%, with a mean 5-year earnings CAGR for the period of 7.3% and a median 5-year earnings CAGR of 5.9%.
Free cash flow (FCF) rose from $2.69 billion in 2018 to $13.64 billion in 2022, at a 5-year CAGR of 26.35%. In that time, the firm generated $28.73 billion in FCF, or over half of its market capitalization. We know that the value of a business is the present sum of its future cash flows, and so, by increasing its FCF, management is increasing the value of the business.
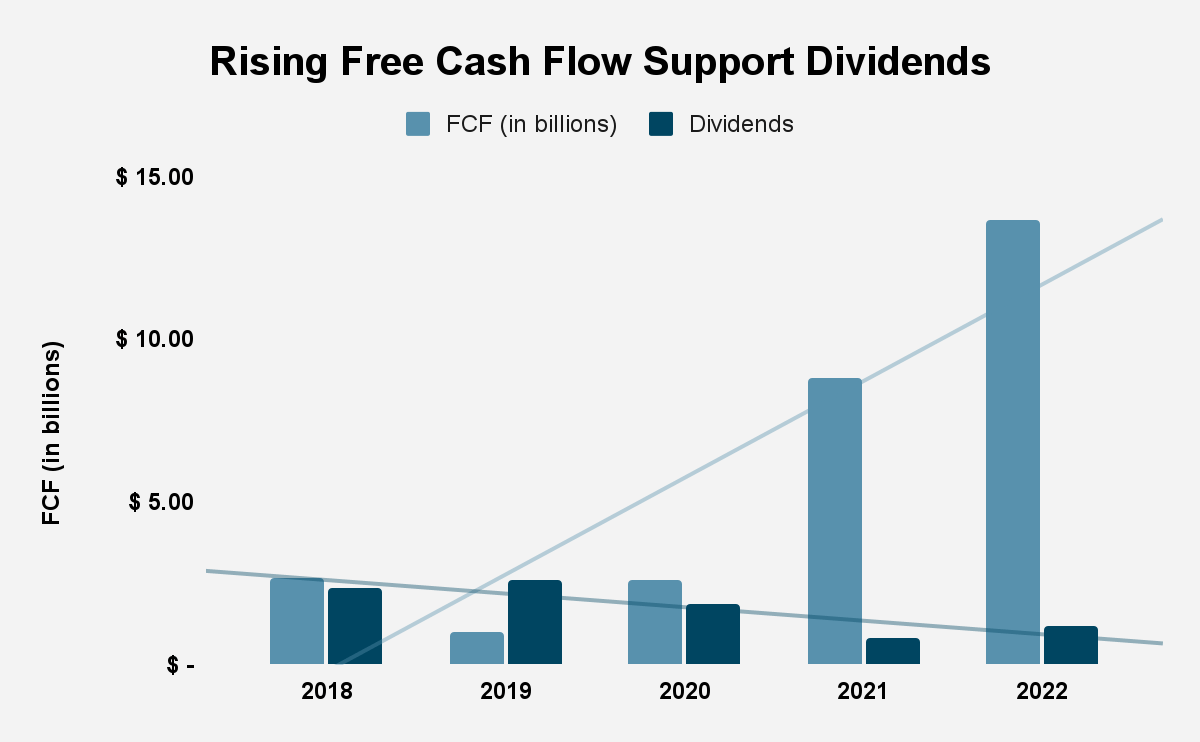
Source: Occidental Petroleum Corp. Company Filings
The growth in FCF has supported the company’s dividend policy. Dividend payouts fell from $2.37 billion in 2018 to $1.18 billion in 2022, given the difficulties the firm has had, but, between 2021 and 2022, dividend payouts grew from $809 million to $$1.18 billion.
Valuation
Occidental has a price-earnings (PE) multiple of 5.08, compared to a PE multiple of 21.94 for the S&P 500. In turn, the company has an FCF yield of 24.09%, compared to a market cap. weighted average FCF yield of 16.02% for its peer group. In addition, the company’s gross profitability of 0.22 is lower than the 0.3 market cap. weighted average gross profitability of its peer group. Finally, Occidental’s shareholder yield of 3.59% is lower than that of its peer group, which is 6.86%. What this tells us is that the company is likely to outperform the S&P 500, and its peer group, despite offering a less profitable business model.
|
Company |
Ticker |
TSR |
Gross Profitability |
FCF Yield |
Shareholder Yield |
Market Cap. (in billions) |
|
Occidental Petroleum Corp |
OXY |
-2.96% |
0.22 |
24.09% |
3.59% |
$ 56.62 |
|
BP plc |
BP |
-2.54% |
0.27 |
25.27% |
8.85% |
$ 117.01 |
|
Chevron Corp |
CVX |
47.01% |
0.28 |
12.60% |
3.13% |
$ 319.65 |
|
ConocoPhillips |
COP |
79.22% |
0.40 |
14.02% |
8.79% |
$ 129.51 |
|
EOG Resources, Inc. |
EOG |
13.39% |
0.39 |
9.18% |
6.92% |
$ 70.16 |
|
ExxonMobil Corp. |
XOM |
54.20% |
0.31 |
12.47% |
5.83% |
$ 468.37 |
|
Hess Corp. |
HES |
178.31% |
0.30 |
2.83% |
1.01% |
$ 43.13 |
|
Marathon Petroleum Corp. |
MPC |
76.01% |
0.31 |
24.69% |
21.19% |
$ 56.83 |
|
Phillips 66 |
PSX |
7.21% |
0.25 |
18.18% |
-3.73% |
$ 47.40 |
|
Pioneer Natural Resources Company |
PXD |
21.18% |
0.37 |
14.95% |
10.65% |
$ 48.92 |
|
Shell plc |
SHEL |
-5.08% |
0.19 |
22.74% |
10.99% |
$ 207.74 |
|
TotalEnergies SE |
TTE |
8.86% |
0.31 |
20.89% |
7.74% |
$ 154.20 |
|
Valero Energy Corp. |
VLO |
42.92% |
0.28 |
22.07% |
5.69% |
$ 48.77 |
|
Peer Group Average |
39.20% |
0.30 |
16.02% |
6.86% |
$ 1,711.69 |
Source: Company Filings
Conclusion
Occidental Petroleum, at one time, was headed for trouble, and was seen as a very bad bet by investors. However, since 2020, the company’s operating and financial results have improved, and with that, the company’s stock market and TSR performance have also risen. The company remains undervalued compared to the market, with a very attractive FCF yield, and so the firm is likely to continue to perform well against the market.
Read the full article here


