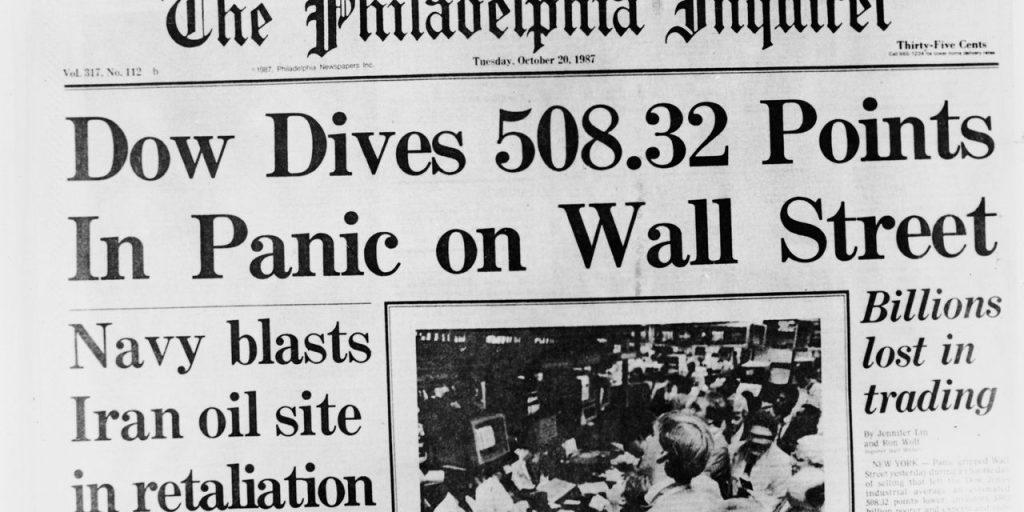
Thirty-six years ago, on Oct. 19, 1987, the U.S. stock market suffered its worst crash ever. That day, the Dow Jones Industrial Average
DJIA
lost 22.6%.
The good news is that the odds are extremely low that U.S. stocks in the next several months will experience a comparable single-session decline.
The bad news is that those odds aren’t zero. Though the odds on any given day are low, chances are high that a drop of such magnitude will take place someday. Investors need to take those odds into account as they devise portfolio strategies, either on their own or with a financial adviser’s help.
We know the odds of a crash because researchers several years ago derived a formula that successfully predicts the average frequency of stock market crashes over long periods of time.
According to that formula, there’s a one-in-five chance that over the next 30 years the U.S. market will see another 22.6% one-day drop.
Need to Know: Stanley Druckenmiller says central banks, not earnings, move markets. His axiom will be put to the test Thursday.
One way of judging the researchers’ formula is by comparing the Dow Jones Industrial Average’s big drops over the past century with what that formula would have predicted. As you can see from the chart below, the formula has done an impressive job.
Insuring against a crash
To be sure, the researchers’ formula doesn’t predict when crashes will occur, only their frequency over long periods of time. You might think that means you can’t plan for them. But that isn’t so, according to Nassim Taleb, a professor of Risk Engineering at New York University.
In his well-known book “Black Swan: The Impact of the Highly Improbable,” Taleb in effect argues that we’re wrong to think that daily stock market changes neatly fall into a bell-shaped or “normal” distribution, with most of those changes being minor (the hump in the middle of the bell) and a few big gains and a few big losses in the right and left tails of that distribution. Instead, the left side of that distribution is fatter than expected; that fat tail contains what Taleb refers to as “Black Swans.”
Because stock market gains and losses don’t adhere to a normal distribution, both investors and financial advisers are mistaken in thinking they can simply lower clients’ portfolio risk and proportionally reduce their returns. Instead, an “average” risk portfolio will have below-average performance.
Taleb writes: “[B]ecause of the Black Swan, [your strategy should be] … as hyper-conservative and hyper-aggressive as you can be instead of being mildly aggressive or conservative. Instead of putting your money in “medium risk” investments… , you need to put a portion, say 85 to 90 percent, in extremely safe instruments, like Treasury bills. … The remaining 10 to 15 percent you put in extremely speculative bets, as leveraged as possible (like options).”
To illustrate, imagine allocating 90% of your portfolio to one-year U.S. Treasury bills
BX:TMUBMUSD01Y
and buying one-year call options on the S&P 500
SPX
with the remaining 10%. Since T-Bills currently yield more than 5%, you will not lose money over the next year even if the call options expire worthless. If instead the S&P 500 rises enough to pay for the option’s premium, you will turn a profit. And if the stock market skyrockets, you will realize an outsized return.
That’s just one example. Another possibility is to substantially invest in equities and allocate the remainder to S&P 500 put options. Regardless, you will definitely sleep better for it.
Mark Hulbert is a regular contributor to MarketWatch. His Hulbert Ratings tracks investment newsletters that pay a flat fee to be audited. He can be reached at mark@hulbertratings.com
Read on: Wall Street warns of ‘Black Monday’ repeat just in time for 36th anniversary
Also see: Wall Street’s biggest bear is standing by his call for stocks to slump 10% by January. Here are 4 charts that support his point.
Read the full article here


