

")


For the fourth calendar quarter of 2023, an average partnership interest in Artko Capital LP was up 6.9% net of fees. At the same time, investments in the most comparable market indexes-Russell 2000 (RTY), Russell Microcap, and the S&P 500 (SP500, SPX) -were up 14.0%, 16.1%, and 11.7% respectively.
For the calendar year of 2023, an average partnership interest in Artko Capital LP was up 1.6% net of fees. At the same time, investments in the most comparable market indexes-Russell 2000, Russell Microcap, and the S&P 500- were up 16.9%, 9.3%, and 26.3% respectively. Our detailed results and related footnotes are available in the table at the end of this letter. Our positive results this year came from Potbelly (PBPB), Currency Exchange International (OTCPK:CURN) and Research Solutions (RSSS), while a pullback in Shyft Group (SHYF) and Polished.com warrants (OTC:POLSW) detracted from the overall performance. We share our outlook and full portfolio review for 2023 in the sections below.
|
1Q23 |
2Q23 |
3Q23 |
4Q23 |
1 year |
3 year |
5 year |
Inception |
Inception |
||||||
|
7/1/2015 |
Annualized |
|||||||||||||
|
Artko LP Net |
16.0% |
-1.7% |
-16.7% |
6.9% |
1.6% |
-7.1% |
0.5% |
28.6% |
3.0% |
|||||
|
Russell 2000 Index |
2.3% |
5.2% |
-5.1% |
14.0% |
16.9% |
2.2% |
10.0% |
81.7% |
7.3% |
|||||
|
Russell MicroCap Index |
-3.6% |
5.3% |
-7.9% |
16.1% |
9.3% |
0.6% |
8.6% |
59.7% |
5.7% |
|||||
|
S&P 500 Index |
7.5% |
8.7% |
-3.3% |
11.7% |
26.3% |
10.0% |
15.7% |
169.3% |
12.4% |
The River Flows
“Don’t go chasing waterfalls. Please stick to the rivers and the lakes that you’re used to.”– TLC
One of our favorite mental exercises is to distill the complexities of the market, with millions of participants and thousands of external environmental factors, into more relatable, real-life examples where the visual can create a more understandable representation of the factors that influence the market’s direction. This isn’t an original thought, and one of our favorite examples of the creativity of humanity to help with the visualization problem was the 1949 invention of the Phillips Machine, also known as the MONIAC (Monetary National Income Analogue Computer), Phillips Hydraulic Computer, and the Financephalograph. It is an analogue computer that uses fluidic logic to model the workings of an economy. Observing the machine in operation makes it much easier for investors to understand the interrelated processes of an economic system.


The machine is approximately 6 ft 7 in high, 3 ft 11 in wide, and almost 3 ft 3 in deep. It consists of a series of transparent plastic tanks and pipes fastened to a wooden board. Each tank represents some aspect of the UK national economy, and the flow of money around the economy is illustrated by colored water. The flow of water is automatically controlled through a series of floats, counterweights, electrodes, and cords. The flow of water between the tanks is determined by economic principles and the settings for various parameters. Different economic parameters, such as tax rates and investment rates, can be entered by setting the valves that control the flow of water about the computer. For the curious mind, a few machines are still in working order and are on display in places such as the University of Leeds Business School, London School of Economics, and Istanbul University.
The fascinating concept of the Phillips Machine, which your portfolio manager learned decades ago, has resulted in a never-ending career quest to create more visual representations of our thought processes when it comes to the equity markets. The best example we can think of when it comes to visualizing markets is that of rivers, which are incredibly important to wider ecosystems and whose stocks and flows have natural and manmade exogenous factors that can create substantial changes in the river’s environment. While, of course, the creation of manmade dams over the last century is the obvious parallel with direct consequences for global river systems, one of our favorite examples of the river’s environmental complexities is how the introduction of wolves into Yellowstone Park in 1995, after a 70- year absence, substantially and unintentionally changed the park’s river system through a trophic cascade-an ecological process that starts at the top of the food chain and tumbles to the bottom. The reintroduction of wolves to the ecosystem changed the grazing behavior of its top prey, the elk, which began to avoid certain geographical areas where they could be trapped more easily, particularly the valleys and the gorges. This, in turn, spurred incredible growth in vegetation and regrowth of forests, which reintroduced more species such as beavers and otters, all of which contributed to substantial geographical changes in rivers. The rivers meandered less, there was less soil erosion, channels narrowed, more pools formed, regenerating forests stabilized the banks, and the physical geography changed substantially.
The savvy reader of our letters can probably see where we are going with this. If the rivers are the market, then the Federal Reserve and the regulatory agencies are the dam-building and wolf population-controlling agencies that can, and do, create substantial changes in the market rivers and their ecosystems. With the Federal Reserve being the “unnatural” dam maker in controlling the flows of the market rivers, the stopping of its flows and the subsequent re-flooding of the economic river as a result of the Covid-19 pandemic with monetary stimulus has substantially changed its downstream flows. As it directly relates to our visualization of the small and micro-cap segments of the market, it seems that the same forces that unleashed the wave that propelled large capitalization and tech companies to ride the powerful liquidity stream ended up creating stagnant pools of water on the banks of the rivers, increasingly untouched by the subsequent regular monetary flows into the system. Looking back even further, in the wake of the Great Financial Crisis, Wall Street, fearing a drought, introduced a heretofore rarely seen Silicon Valley “species” to its public equities ecosystem, seemingly uncontrolled by the regulatory agencies, which also substantially changed the “river banks”, though, in your portfolio manager’s humble opinion, not necessarily in the positive way that the introduction of wolves changed Yellowstone.
This is the environment that we’ve mentally been wrestling with for the last few years. The foundation of this partnership has always been grounded in the belief that we’re all floating on the same river, and a variation on “a rising tide lifts all boats”-a Fed dam release lifts all boats-would carry our “microcap boats” alongside their larger-cap brethren. In that sense, trying to pick the best boats is a more useful exercise than timing the flows and the turns of the river itself. The proverbial market river was always seen as just a place for our boats to get in, out, and to travel on. However, with the introduction of the “Silicon Valley” species into the market river ecosystem and the “park rangers” seemingly asleep at the gate, the focus of the marginal market participant increasingly turned from finding the best boat to navigate the rapids to catching the next momentum wave on flimsier and flimsier rafts, with dangerous captains, that ordinarily would quickly sink but due to the increasingly passive and focused flows that bypassed the aforementioned pools, look like Donzi speedboats.
Which brings us all the way back to our partnership holdings and our portfolio review and outlook.
2023 started out as a year where “our boats” seem to be lifted out of their swamp-like stagnant pools only to stay seemingly in place, up only 1.6%, while the sinking flimsy rafts of tech companies were rescued by another burst of tech momentum waves. While we’ve certainly had substantial fundamentals growth and some stock price appreciation, such as a doubling in Potbelly stock, as a concentrated portfolio, even one mistake can cost you a whole year, and our “adventure” in the Polished.com warrants cost us almost 400 basis points of performance this year. We’ll discuss our frustrations with this investment in more detail below, and while the losses here certainly stung a bit, our “activist” efforts this year in Acorn Energy (OTCQB:ACFN), Research Solutions (RSSS), and Currency Exchange International (OTCPK:CURN), which together represent close to 60.0% of our portfolio holdings, are beginning to bear some real fruits which we hope to harvest in the near future.
We’ve written to you in the past years about what we considered naivete by the Federal Reserve in assuming that the substantial bouts of inflation in 2021 and 2022 are “transitory” and that inflation is an animal, that once is out of its cage, is incredibly hard to put back in and unfortunately our predictions are showing themselves to be correct. While the 500 basis point increase in rates in the last 2 years has certainly lowered inflation from high single digits to close to 3.0% with a pleasant bonus of continuing strong economic growth, the “last mile” effort of getting inflation down to the 2.0% target without denting the economy will be uncomfortable for those hoping for lower rates in the near future, a prospect we see as unlikely until at least mid to late 2025. As such, the prospect of a stable economic and interest rate environment is likely to remain elusive for at least another year, and the boats may continue to swirl in stagnant waters.
These are frustrating times. As you will see in our statistics and portfolio discussions below, 2023 was a solid year for the fundamentals of our companies on a consolidated basis. Our portfolio remains statistically cheap on many metrics. Yet a lot of our boats seem to be moored. We see a number of paths. One is to stay the course. Eventually the excess liquidity will dry out via an extended period of elevated rates and the rivers will return to regular flows. The question we continue to ask ourselves, as do most of our peers: are these rivers fundamentally altered and there’s no going back? Path two is to recognize that the answer to the question is yes and to alter the strategy from boat picking to focusing more on river flows and only on crafts that navigate these flows. We’ll refer to this path as “chasing waterfalls”. Finally, there’s a third path. If the river won’t come to you, you focus on fewer boats and get them to the river yourself. This is not unlike what we’ve been trying to accomplish with CURN, ACFN, and RSSS. These are great boats that needed a few extra pushes to get them unmoored. So far we’ve taken the combination of paths one and three. We are staying the course hoping the rivers aren’t forever altered, where our performance in Potbelly last year gives us said hope that things haven’t changed permanently, while on the margin, trying different approaches of getting some of our boats to them. In 2023 we dropped some dead weight and added a new investment in Maui Land and Pineapple Company (MLP). We are in the process of patiently investing in a very illiquid but substantially profitable net net, i.e. a company whose market capitalization is less than the net cash on its balance sheet. By mid-2025, our partnership would be ten years old, and we believe this would be a great time to assess whether paths two or three are the more prudent course. In the meantime, as our quote above from TLC implies, we won’t be chasing waterfalls and will be sticking to the rivers and the lakes that we’re used to.
To share some portfolio statistics for 7 companies which represent approximately 98% of our portfolio:
- Our median/average market cap is $182mm/$221mm. These numbers compare to $219mm/$864mm for the Russell Microcap Index, our closest comparable index, and represent our continued commitment to offer you an investment product in securities that for the most part are unable to be included in an index due to their size or liquidity constraints.
- Our median/average portfolio’s net cash balance is 2.0%/13.0% of the market cap representing our commitment to strong balance sheets.
- Our median/average insider holding is 26.0%/26.5% at over $30mm of what we call insider-value- at-risk, which we believe is an important metric where we feel we are co-invested alongside our management teams and have shared incentives and risk tolerances.
- Our median growth expectations for our companies’ EBITDA/Cash flows for the next 5 years are at 40.0%/40.0% and our median valuations for next twelve months EV/EBITDA and Price to Cash Flows are at 6.0x/8.5x for 2024.
Portfolio Review
Currency Exchange International (OTCPK:CURN)- 19.0% of Portfolio; $8.08 cost basis/$18.00 current price
CURN was a good performer for us in 2023, up almost 11.0%, though down about 12.0% from its winter 2023 highs. Operationally, the year was a mixed but mostly positive bag. The company continued to grow its revenues, up 21.0%, on the back of strong 23.0% Banknote segment revenue growth, as the company continued to substantially expand its physical footprint, seen in the table below. Additionally, the strategically important Banknote Wholesale subsegment grew 31.0% in the United States, representing over 35.0% of overall revenues, reaching almost $30mm.
The Payments segment revenue grew a slightly disappointing 15.0%, but the bigger thing to note on the year was the 30.0% growth in operating expenses, leading to a flat $19mm Earnings Before Interest and Taxes (EBIT) year. Segmenting out the $14mm+ operating expense growth, the increases accounting for most of the growth came from salaries, shipping, and supposedly one-time losses and shortages of almost $3mm. The latter expense is a small red flag. However, for 2024 and beyond, shipping costs have been mitigated with pricing increases, and salaries are an investment in future growth from which we expect substantial operating leverage on future revenue increases. It is almost impossible to expect linear growth in profitability in small-cap companies. The Value Line earnings quality scores of 90+ are reserved for predictable large-cap companies like Johnson & Johnson. As such, we are confident that with 2023 expense investments in salaries; a new Enterprise Resource Planning (ERP) software; as well as continued growth in revenues, the company should reach $95-100mm in revenues and $25mm-$30mm in EBIT in the next 12-18 months. These results should be bolstered by the continued tailwinds in American tourism that is expected to keep growing in low single digits, as seen in the chart on the next page; continued market share gains in retail and wholesale; as well as the company beginning to increase pricing given its market share and current, what we believe, product underpricing.
Which brings us to our efforts in helping to bring this $115mm market capitalization company, with $82mm in total net cash (of which approximately $50mm is working capital cash needed for operations), that generates over $20mm in high-growth EBIT, to better allocate its capital. As you’ve seen in our memo to the company, which we shared with you during 2023, we believed that continuing to build up cash on the balance sheet while the company is trading at 1.5X EBIT and generating high teens returns on capital was highly inefficient. After a lengthy back and forth exchange with management, in November 2023, the company announced a stock buyback of 5.0% of its shares. While the size of the buyback is tempered by Canadian stock exchange rules, we believe this action to be a great first step. While, of course, spending $6-7mm a year at current stock prices to reduce the share count by 5.0% a year is a big step in the right direction on its own, we believe the optics of a management team that is both beginning to understand the importance of capital allocation and listening to its shareholders are the more important signals to the market. While we have no illusions about current small-cap valuations, in this particular case, bringing “our CURN boat to the river,” where we believe that these capital allocation steps alongside continued growth in revenues and returns on capital, should begin to make the market appreciate the tremendous value of this company and, at what we consider a low, 8x EBIT, target multiple and $30mm+ in excess cash, should result in a near term $40 price target, or over 100.0% from today’s price.
Research Solutions (RSSS)- 24.0% of Portfolio; $1.80 cost basis/$3.20 current price
Our investment in Research Solutions, originally at sub $1.00 in 2017, though with substantial additions over the years our cost basis has drifted higher, was down 22.0% in 2022, up 41.0% in 2023 and up over 25.0% so far this year. This was an interesting and a bit tumultuous year for the company and the stock but the end outcome, fundamental growth and the future outlook all look excellent from this point. The provider of information services for the scientific industry, not unlike Bloomberg is for finance and Lexus Nexus is for law, grew its 2023 revenues 15.0%, up from 8.0% last year, and what we believe to be the more important metric, its gross profit, over 21.0%.
As a reminder, Research Solutions has a legacy Transactions business, the sale of scientific articles to over 1,360 customers, up 13.0% from last year, including 70.0% of the top 25 pharma companies. Up until 2022, this business has been a steady $26mm to $27mm revenue run rate segment for as long as we’ve been shareholders, and with its 23%-24% gross margins has been a consistent generator of $6.0 to $6.5mm in gross profit. However, with a minor acquisition of a European customer list in 2022, as well as expansion of transaction demand creating Platforms segment, the 2023 segment revenues were over $30mm with close to $7.7mm in Gross Profit, 13.0% and 19.0% 2023 growth, respectively.
With the client list acquisition anniversary in 2024, we expect the revenue growth to temper to low-single digits again, as the Platforms segment begins to cannibalize demand instead of helping it, and for gross profit to stay slightly over $8mm. This is still a substantial and unexpected “surprise” from just a few years ago when the segment had multiple negative revenue growth quarters. While all of the focus continues to be on the Platforms segment discussed below, this steady cash cow segment has shown itself to be a valuable part of the company. We believe the segment’s value is approximately $1.00 per share as we begin to think about eventual exit multiples for the company in an event of a transaction.
Platforms, a SaaS solution to the scientific research community, which has an average price point of $12,330, again grew its revenues at 32.0% to $10.3mm and Annual Recurring Revenues (‘ARR’) to $15.7mm (or 77.0% growth) as the company absorbs two significant acquisitions in 2023. In a flip of the margin contribution picture, Platforms’ gross margins are 86.0%, and its gross profit, at $8.8mm, is bigger than the Transactions segment’s 25.0% margin gross profit and now represents 54.0% of Total Gross Profit of over $16.4mm. This was due to 19% growth in subscriptions to 942 and a 13% increase in the average sales price. The company has had a busy year in 2023, acquiring two Artificial Intelligence (‘AI’) companies, scite and Resolute. These are two very exciting acquisitions that as stand-alone companies were interesting but combined in a Platforms segment with the flagship product, Article Galaxy, will create a comprehensive AI based product suite that expands the value chain offerings to the research community and the company’s Total Addressable Market (‘TAN’) many times over. Additionally, while the scite acquisition’s financial metrics are impressive and are already outperforming, what is more notable about this acquisition is that this creates a hereto-hard-to-penetrate backdoor to most publisher databases, creating a substantial moat for the combined scite/Resolute/Article Galaxy product suite.
This was what we consider a substantial and transformative year for the company, but it wasn’t without some tumult. Over two years ago, the company founder Peter Derycz, someone we respected and admired since our original investment in 2017, stepped down and took over the Chairman position while allowing new CEO, Roy Oliver, to take over the operational reins. Roy had put out substantial goals for the company, including almost tripling the Platforms ARR to $20mm by late 2024. This goal included an acquisition piece as well. The 2021 and 2022 years could be considered somewhat below plan as the company expanded its expense base to support the upcoming growth, while at the same time facing a slowing research customer market and overpriced acquisition targets. In the summer of 2023, a frustrated Peter Derycz, as Chairman, launched a surprising, and frankly incredibly unprofessional, proxy fight, with Roy and the rest of the board, as he was continuously being sidelined at board meetings and was frustrated with the expense base growing ahead of revenues. This was amateur to say the least and more annoyingly, distracting from the closing of the scite and Resolute acquisitions, which Peter knew about. The shareholder base response was angry and swift. This is where, while not on the board, our representation of close to 5.0% of outstanding shares helped behind the scenes. Peter was removed from the board, his value destroying brother-in-law forced to sell down his investment stake to below 5% to prevent him from being a further negative detractor from the stock and the story, and the board added one new independent member. With the majority of substantial shareholders and management team in agreement over the near-term future plans for the company there was no need to fight for an additional board position and we were happy with the outcome that was achieved with some behind the scenes communication.
So what does the future look like in the near term? It appears that Roy will be able to achieve, or come very close, to getting to the $20mm ARR number by 9/30/2024, the three-year anniversary of the goal. Additionally, the company put out more ambitious goals of growing Platforms organically at a 30%+ rate to a $30mm ARR target by late 2026. It’s a high hurdle, but with the cross-selling opportunities and other strategic synergies of the two acquisitions, we believe to be very achievable. However, we do not expect the company to remain public for long. With the $20mm/3-year Platforms ARR goal “in scite” (sorry, sometimes we can’t help but make a bad pun) we anticipate the company to begin a sales process in the 2nd half of 2024 and the 2026/$30mm ARR number was more of a helpful guidepost, for likely acquirers, of the company’s potential than actual guidance. We believe with the company sporting close to 1,000 subscribers paying over $12,000 a year on average; as well as its access to publisher’s databases, as well as significant AI capabilities, its strategic and financial acquisition value and multiples should be on par with other information service providers such as FactSet, Verisk, and CoStar group at over 10x forward revenue multiples and 20-30x EBITDA multiples. While a sale may not happen in 2024, we anticipate one in the next 12-18 months at $7.00 to $10.00 price targets or over 200.0% from today’s stock price.
Acorn Energy (OTCQB:ACFN)- 12.0% of Portfolio; $4.80 cost basis/$6.00 current price
Acorn’s price performance, down 45% in 2022 and up 13% in 2023, has been frustrating, but not out of the realm of normality of the nanocap world, given the company’s average daily volume is less than $9,000. It is closer to a private equity investment than a public one. 2023 was a decent year fundamentally for the $15mm market capitalization company, whose main business is providing monitoring services for backup electrical generators in the United States. This is a nice, very high-margin, recurring revenue business with a typically low churn $4.5mm monitoring revenue base at close to 90% gross margins. The other half of the $8mm+ cash revenues is the sale of hardware, where any revenues above a few hundred thousand result in an increase in the valuable monitoring revenue base.
2023 was a year in which the company continued to shoulder some losses of customers as the 2022-2023 period saw the sunsetting of 3G technology, which resulted in a one-time loss of usually very high recurring revenue customers who chose not to go through the hassle of installing and paying for new technology. The company’s natural organic revenue growth rate is 20%, but it is not linear. In 2022, the company’s revenues grew 3%, and 11% in 2023, continuing to absorb the technological sunsetting. However, the company managed to grow its gross profit by 15% for the first nine months of 2023, and by the 3rd quarter of 2023, the revenues and gross profits grew back to the expected run rate at 22% and 28%, respectively. More importantly, the end of 2023 saw some significant developments that are setting up for a strong 2024 and beyond.
While it has taken a little longer than anticipated due to operational hurdles, 2024 should begin to see revenues from the company’s Demand Response program, where the generator monitoring customers will be part of the electric grid, providing backup power not only to their homes but to the grid in case of overload. The customers, brokers, and technology providers, in this case, OmniMetrix, will all participate in the revenue share from the utilities for providing this service, which should significantly boost the Average Revenue Per User (ARPU) for Omni’s monitoring service subscribers. We don’t anticipate more than a few hundred thousand dollars or a few hundred basis points of revenue growth off this project in 2024, but we believe by the second half of 2024, we will begin to see substantial revenue pick up as the company begins to leverage its 2023 operational and technological investments in the program. Just as significantly, in the fall of 2023, the company announced a reseller agreement with one of the country’s largest commercial generator dealers that could result in as much as an additional $2mm in 2024 revenues, and more importantly, substantially contribute to the 90% gross margin monitoring revenue base. We believe that in 2024, the OmniMetrix subsidiary can grow its revenues at more than 25%, above a symbolically important $10mm number, achieve close to 30% operating margins, and generate substantial cash flow at the Acorn Energy holding company level.
The fundamental story is great, but Acorn remains an example of a company that has not caught the powerful Federal Reserve liquidity release streams and continues to tread water in the microcap swamp pools. To that end, in 2023 your portfolio manager joined the board of directors of this company to help with unlocking the substantial value, including over $70mm in Net Operating Losses (NOLs), for the shareholders. There are two paths that can happen with this company: one is the continued strong growth and profitability and uplisting to Nasdaq, i.e., bringing the proverbial boat to the river, which should result in a stock price many multiples higher than today’s price implying only a $15mm market capitalization. Accordingly, the company has taken its first steps toward the uplisting by doing a reverse 1-16 split, getting its stock price above $5.00. This move should create slightly more liquidity and attract investors that have in the past not been able to participate due to the company’s former penny stock status. There are other opportunities to enhance this path that are in process. Of course, the second option is an outright sale of the company, with the valuation closer to mid-single-digit revenue multiples for similar Internet-of-Things companies, and where the company’s valuable NOLs are taken into account. 2024 should have some updates on which one of these paths is the most likely to maximize shareholder value.
As a final note, please be aware that our discussions here are from publicly available information as of 9/30/2023, and there are things we are not able to update you on due to our responsibilities as a member of the board of a public company.
Together, these three companies represent close to 60% of the portfolio today, which also reflects ourconfidence as well as time commitments where we are working on helping to unlock significant value.
Potbelly (PBPB)- 17.0% of Portfolio; $3.70 cost basis/$14.00 current price
After remaining flat in 2022, Potbelly was our big winner in 2023, up almost 100%, and another 30% so far this year. As a reminder, our investment in PBPB was originally a post-Covid recovery special situation with a substantial opportunity to change its business model from managing 400 specialty sandwich shop locations to managing 2000+ franchises as the company hired former Wendy’s COO, Robert Wright, to execute on the strategy.
Our thesis continues to play out and then some. For 2023, the company’s same-store sales are expected to come in at 12.0%, while below last year’s 18.0%, strongly above average in the Quick Service Restaurant (‘QSR’) industry in 2023. Additionally, shop-level margins are expected to be 14.0%, almost a full 4.0% improvement from 2022. While the average unit volumes (AUVs) are in the industry’s upper echelons at $1.3mm/year, we believe shop-level margins have a bit to go, to higher teens, from here. The overall 2023 revenues should come in above $490mm or 9.0% higher than year-end 2022 while EBITDA should be close to $30mm, though still only 6.0% margins, with a lot more room for expansion, especially as franchised locations continue to be a bigger part of the mix.
The company currently has 430 locations, which is flat unit growth for 2023; however, that mix now includes 69 franchises, or 16.0% of the mix, up from 45/10.0%, from last officially reported 9 months ago. This resulted in year-on-year growth for the first 9 months of 92.0% in Franchise Royalty fees, whose marginal contribution to future profitability and cash flow generation is expected to be substantial. The near-term goal remains for the current base to be at a 25.0% franchised mix, meaning there are approximately 40 currently owned locations which can be sold to franchisees at what we believe can be $500k to $1.5mm per location resulting $20mm to $60mm in cash inflow to this $400mm market cap company. Additionally, the company has a goal to grow to 2,000 shops, growing franchised locations at about 10.0% per year. To that end, the company has signed Shop Development Area Agreements for 150 future locations (which may take up to 7 years to open) in 2022 and 2023, which is a fantastic 100-unit pipeline growth from last year. We believe this pillar of the company’s strategy to be the most important one, and the key to our thesis as we still believe it may add $5.00 to $40.00 more per share to the value of the company in addition to its ongoing business valuation. So far, this investment is approaching a 300.0% return for us, and we’ve taken a little bit off the table, though still holding close to 80.0% of our original shares, as we think there should be at least one more doubling from here in the intermediate term as the company still has substantial aforementioned value creating levers to pull.
HireQuest (HQI) – 11.0% of Portfolio; $5.50 cost basis/$13.40 current price
HireQuest, the company, had a bit of a mixed bag fundamental year with mostly positive results. HireQuest, the stock, had a flat 2023. However, with an up/down 80.0% round trip, it remains substantially above our original purchase prices. A combination of cyclical labor market fears and challenges in absorbing a large acquisition resulted in a disappointing year for this investment.
The company, which had a great 2022 with revenues up 67.0% for the nine months ended on September 30th, 2022, grew its 2023 first nine-month revenues by 23.0%. More importantly, its Franchise Royalties, which account for most of the profit, increased almost 27.0% for those nine months, though that number is mostly due to the MRI acquisition, with labor market softness offsetting the impressive growth. With the MRI acquisition came a 54.0% increase in SG&A expense, a number that does not include volatile workman’s compensation expense that in the 3rd quarter of 2023 came in at almost $3mm or almost 30.0% of revenues. Overall, 2023 was a kitchen sink year where a combination of a slowing labor market, surprising workman’s compensation expenses, and a slower-than-expected culling of expenses from the MRI acquisition made for some jittery stock performance.
As a reminder, HireQuest, now a $180mm market cap company, is a consolidator in the staffing industry, acquiring $32mm worth of businesses in 2021 and 2022, with over $20mm in 2023. Led by its impressive CEO Rick Hermans, the company buys owned locations, sells them via franchise agreements to the branch managers, and collects an approximately 6.0% franchise fee off the subsequent revenues. This model has been incredibly successful due to providing the right entrepreneurial incentives to salaried branch managers who get to have an opportunity to earn six-figure entrepreneurial incomes. While there are, what we believe to be unfounded, fears of an economic slowdown, which have been given more room in the market participants’ minds than we believe necessary, the unemployment rate is still only 3.7%, up only slightly from 3.4% last year, despite a 5.0%+ increase in interest rates. The company increased its system-wide sales run rate from $500mm last year to close to $650mm in late 2023, with the acquisition of TEC Staffing Services in late December, implying a $40mm+ franchise royalty fee revenue run rate. While the aforementioned expense issues were not great from a one-year snapshot perspective, overall we believe the company will come out of 2023 with an efficient, sub-$20mm expense base, which Rick should be able to continue to leverage in stacking more on top of a “high franchise royalty fees/low marginal expenses” business model.
As we usually mention in our letters, while we are contrarians on the path of inflation and interest rates, we have also been contrarians on the path of economic growth in the United States and believe that the resilience of the domestic economy can continue to produce low unemployment rates, relative to historical averages, for at least a few more years. As such, we expect continued strong organic growth and acquisition opportunities to grow the company’s EBITDA to over $30mm toward the end of 2024, where an 8x to 10x multiple, which we believe is appropriate given the lucrative franchise economics of this business model, should result in a near-term price target of $35.00, once cyclical and expense fears dissipate. Of course, we intend to continue holding this investment through the cycle, other than risk management adjustments, until Rick Hermans eventually sells the company.
Shyft Group (SHYF)- 10.0% of Portfolio; $9.50 cost basis/$11.00 current price
Much like our investment in HireQuest, 2023 was the year our long-term holding, Shyft Group, faced cyclical headwind fears and realities, declining over 50.0% in 2023 on top of a 50.0% drawdown in 2022. What a continuous gut punch from a company whose business model we’ve admired since our initial investment in 2017. During this time, the company, formerly known as Spartan Motors, divested its money-losing Emergency Response segment and strengthened its Fleet Vehicle and Services (FVS) segment with tuck-in acquisitions, narrowing its focus on supplying the growing e-commerce-led parcel delivery business with its capital-light commercial truck and specialty vehicle assembly model. In 2021, the company, anticipating the shift to electric vehicles, launched BlueArc, an impressive commercial-class electric walk-in van and beyond.
However, since 2022, several headwinds have materialized. While the secular tailwinds of e-commerce taking share from retail continue, there is a cyclical slowdown in parcel delivery. Additionally, parcel delivery companies like UPS and FedEx recently finalized expensive labor agreements and scaled back some CapEx expenditures, such as fleet upgrades. Simultaneously, the company’s production schedule for BlueArc faced a major setback as its battery supplier declared bankruptcy, later acquired by Volvo, postponing BlueArc’s revenue generation to 2025. Meanwhile, product development costs continue to impact the income statement as R&D expenses, totaling $30mm annually.
The company, with revenues of $991mm and $1,027mm in the 2021/2022 periods, and a 2021 peak of $95mm in EBITDA, experienced a 15.0% revenue decline in 2023 to $872mm, with flat revenue growth expected in 2024. As mentioned earlier, the ~$30mm of product development costs recognized as Research & Development expenses are distorting the historical and industry comparable profitability. While we anticipate a small portion of the R&D expense becoming an ongoing recurring expense, we don’t believe that number exceeds single-digit millions on an ongoing basis. Consequently, the reported EBITDA numbers of $62mm and $23mm for 2022 and 2023, as well as the guided $50mm for 2024, are actually $95mm, $56mm, and $75mm, respectively. This is significant because, in some industries more than others, the EBITDA number is considered a loose substitute for Free Cash Flow and is the currency of valuations and transactions. With Shyft having a recurring $20mm maintenance annual CapEx spend, a low 2% of revenues number, we believe that an R&D expense-depressed EBITDA is one reason the market is unduly punishing Shyft, showing that its profitability margins are mid-single digits versus the “real” high single-digit ones.
A better, more economically reality-based way to examine the last two years and the next year is that the $330mm market cap company will have generated $225mm in profitability. It has and will spend $60mm in maintenance CapEx, $90mm in growth investments via product development costs, and so far, $60mm in returning capital to shareholders via $46mm in buybacks and $14mm in dividends. We expect a similar $25-30mm return of capital to shareholders in 2024. By 2025, it should be back to above $1b in revenues, a $90mm+ run rate EBITDA, and $70mm Free Cash Flow, with substantial and sustainable BlueArc and e- commerce tailwind-led revenue growth. This is fairly impressive, and taking out fear and cyclicality-based emotions, the 80.0% price drop since 2021 seems aggressively illogical.
Our investments in Shyft and HireQuest, two economically cyclical companies in our portfolio, raise philosophical investment strategy questions. Should a buy-and-hold strategy invest in cyclical companies where, regardless of the quality of the business model, management, and balance sheet, stock prices will follow sentiment, and 15.0% cyclical revenue declines, despite substantial secular tailwinds, will result in near-term 80.0% price declines? Going back to our river analogy, does the quality of the boat matter if the stream it is floating on is going backward? Is patience a virtue or a liability? We have to believe that the core of our investment strategy is investing and holding through cycles, even the most painful bottoms, to get long-term outsized returns, and that from a historic perspective, playing the timing-the- market game is a losing one. We’ve seen Shyft go from $12.00 to $6.00 to $54.00 to $10.00, where we’ve trimmed and added on the margin along the way. We added to our position at $12.00 and $11.00 in late 2023 to make it a full 10.0% position again as we believe that these are temporary headwinds, cycles restart, and the company is in a good position to come out on top to ride the e-commerce and electric vehicle transition tailwinds stronger and more profitably. We are mindful of a new but reputable CEO and will be watching closely. We don’t have confident near-term return expectations as we do with our other Core Portfolio holdings such as CURN or RSSS, but we continue to believe that, in the long term, Shyft Group is a shiny diamond that has multiples of upside from here, to above its previous highs.
Polished.com 6/26 $2.25 Warrants (POL-WS)- 0.1% of Portfolio; $0.29 cost basis/$0.01 current price
As discussed in the 3rd quarter letter, our investment in Polished.com warrants has not been a great adventure. It has cost us a little less than 400 basis points of performance in 2023, in addition to similar losses the previous year. From an update perspective, there isn’t much to report as the company’s public market value of approximately $5mm continues to be an option on its ability to refinance its approximately $90mm in debt. If it can do that, it will still have going concern value and two years left on the warrants to bring revenues and profitability back to a level where the company’s potential in a good economy could result in substantial value. As it stands, while still possible, it does not look probable, given reported tensions between Polished.com and its Bank of America lenders. We suspect that this investment’s value lies in recognizing long-term taxable losses to offset eventual long-term gains in the rest of our portfolio.
We’ve had mixed success with our adventures in warrant investments over the last nine years. We’ve had decent returns on our Hostess, Del Taco, and US Ecology (NRC Group) warrants in the past. However, we’ve also experienced 90%+ losses in Rosewood and, in the most comparable situation, Kodak warrants, where not only did an expected transaction fail to materialize, but the company’s ability to remain a going concern was also questioned by the market. Our lesson learned here is that we need to be better at calibrating sizing despite our confidence in successful probabilities in these investments.
Core Portfolio Sales
Gaia (GAIA)- 4.0% of Portfolio; $6.50 cost basis/$2.50 sale price
As discussed in our 2Q23 Partner Letter, we sold the remainder of our original 8-year-old position in Gaia. While we still made substantial returns in our initial investment, with multiple position reduction sales above $10.00, in recent years, the position has been a significant detractor from performance. The expected fundamentals did not materialize, and key management departures led us to deploy the capital into other positions.
Northern Technologies (NTIC)- 6.0% of Portfolio; $8.80 cost basis/$11.00 sale price
We sold our position in Northern Technologies in the 4th quarter at an average price above $11.00, after almost three years and a 30.0% total return, including dividends. Despite being fans of NTIC, its story, and its management team, we decided to explore opportunities in the market to deploy microcap-focused capital on companies with multiples of upside, such as our newest addition discussed below, Maui Land & Pineapple Company. We will continue to monitor NTIC closely and, if the cyclical and microcap doldrums persist, we may get an opportunity to get back in at below $9.00 again.
Core Portfolio Additions
Maui Land & Pineapple Company (MLP)- 7.0% of Portfolio; $14.80 cost basis/$20.00 current price
We added an initial 6.0% position at below $15.00 a share in the 4th quarter of 2023 as a replacement for our sales of Northern Technologies and Gaia investments. This investment has seen a 35.0% return, mostly in 2024. MLP is a Master Planned Community developer (‘MPC’) that owns tens of thousands of some of the most spectacular acres on the Hawaiian island of Maui, majority-owned by former AOL CEO Steve Case. MLP is in the process of moving from a business stabilization phase to a land development phase. We believe that even a modest development of this incredibly valuable land could result in an intermediate-term Net Asset Value (‘NAV’) of $60.00 to $80.00 per share, and possibly multiples of those targets in the long term.
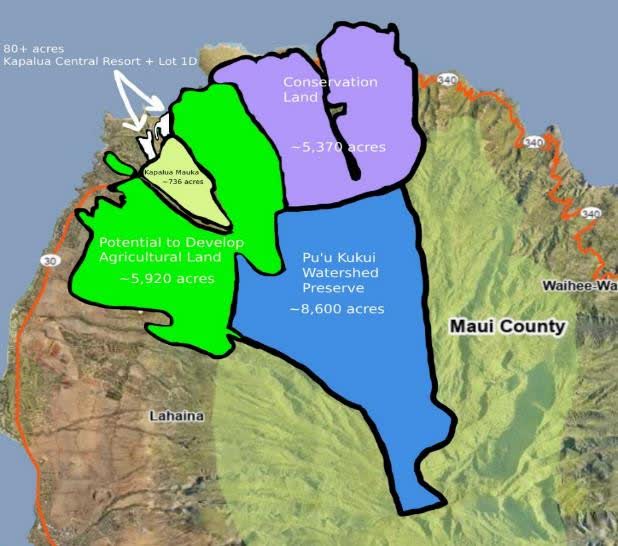

For many years, since Steve Case purchased a controlling stake in the almost 200-year-old company in 1999, the company had been undergoing a restructuring phase. The company closed down the cash- draining pineapple operations, funded the pension plan liabilities, stabilized cash flow to break even, and began to hire a new management team. We believe that the company is on the verge of beginning to monetize its incredibly valuable land holdings in conjunction with the Maui government. Over the last year or so, the company changed its registration to Delaware; completely revamped its board of directors with substantial real estate heavy hitters, including professionals with associations to MPC gold standard bearers of Howard Hughes Corp and St Joe, as well as with Hawaiian professional luminaries; added a new CEO, who in the last few weeks had been awarded over 2% of shares outstanding in 10-year stock options. We love incentive structures where the CEO has the opportunity to make tens of millions of dollars. It even changed its 25-year-old website, which up until a few weeks ago looked like Steve Case designed it himself as an AOL landing page. In short, all signs are pointing that the company is on the verge of a substantial positive directional change. Other positives, much like our investment in RSSS, MLP has an existing leasing business whose Net Operating Income (NOI) covers the company administrative expenses, while it begins to develop its real valuable jewels.
With respect to a price target, we used conservative estimates, high discount rates, and assumed the vast majority of the acreage and infrastructure, such as water, will be given to the government in partnership arrangements. We’ve followed Howard Hughes and St Joe companies for more than a decade and are familiar with the MPC business model. There are a lot of factors that go into becoming a St Joe but at the end of the day its all about location, location, location and MLP has some of the best acreage in the United States. If they do this right, MLP can be a multi-billion-dollar company, and we will carefully monitor the management plans. We anticipate this investment eventually becoming a full, 10.0%, Core Portfolio position, and we are happy with the recent stock run up, and will be monitoring the developments as to when to add more.
As a final note, we are also in the process of adding another position that we would rather not disclose until we’ve finished buying, which may take up to a year. It’s a very illiquid net net, with a $23mm market cap, and $24mm in cash, generating a depressed profitability $4-5mm a year. However, it barely trades, as is the case with some of our positions, so we are being patient. We look forward to updating you once we’ve finished buying our initial position.
Subsequent Events
With Potbelly, Research Solutions and Maui Land & Pineapple Company all being up 25% to 35% in the first two months of the year our portfolio is up approximately 10% year to date.
Partnership Updates
After almost nine years since launching the partnership, we are switching some of our service providers. While we are patiently waiting for our investment strategies to play out, we thought this would be a good time for a refresh and upgrade of our operations support. We are excited to welcome Richey May as our new auditors and are thankful to Berkower for all the years of their audit services. We are also in the process of migrating our fund administration services from HC Global to Formidium. For all statements and tax preparation services relating to 2023, HC Global will be the point administrator for all LPs. Formidium has taken over fund administration services for 2024 and all future statements and operations related investor relations will be serviced by them.
We are not having an in-person partnership event in 2024 and anticipate we will end up having a virtual portfolio update presentation in summer 2024. Please be on the lookout for an invitation in your email inboxes sometime in the next few months. Despite the current small-cap market challenges, we are excited about the growth in assets under management and, as always, are thankful for your business.
Next Fund Opening
Our next partnership openings will be April 1, 2024. Please reach out for updated offering documents and presentations at info@artkocapital.com or 415.531.2699.
Peter Rabover, CFA
Portfolio Manager Artko Capital LP
|
Legal Disclosure The Partnership’s performance is based on operations during a period of general market growth and extraordinary market volatility during part of the period, and is not necessarily indicative of results the Partnership may achieve in the future. In addition, the results are based on the periods as a whole, but results for individual months or quarters within each period have been more favorable or less favorable than the average, as the case may be. The foregoing data have been prepared by the General Partner and have not been compiled, reviewed or audited by an independent accountant and non-year end results are subject to adjustment. The results portrayed are for an investor since inception in the Partnership and the results reflect the reinvestment of dividends and other earnings and the deduction of costs, the management fees charged to the Partnership and a pro forma reduction of the General Partner’s special profit allocation, if applicable. The General Partner believes that the comparison of Partnership performance to any single market index is inappropriate. The Partnership’s portfolio may contain options and other derivative securities, fixed income investments, may include short sales of securities and margin trading and is not as diversified as the indices, shown. The Standard & Poor’s 500 Index contains 500 industrial, transportation, utility and financial companies and is generally representative of the large capitalization US stock market. The Russell 2000 Index is comprised of the smallest 2000 companies in the Russell 3000 Index and is generally representative of the small capitalization U.S. stock market. The Russell Microcap Index is comprised of the smallest 1,000 securities in the Russell 2000 Index plus the next 1,000 securities (traded on national exchanges). The Russell Microcap is generally representative of the microcap segment of the U.S. stock market. All of the indices are unmanaged, market weighted and reflect the reinvestment of dividends. Due to the differences among the Partnership’s portfolio and the performance of the equity market indices shown above, however, the General Partner cautions potential investors that no such index is directly comparable to the investment strategy of the Partnership. While the General Partner believes that to date the Partnership has been managed with an investment philosophy and methodology similar to that described in the Partnership’s Offering Circular and to that which will be used to manage the Partnership in the future, future investments will be made under different economic conditions and in different securities. Further, the performance discussed herein does not reflect the General Partner’s performance in all different economic cycles. It should not be assumed that investors will experience returns in the future, if any, comparable to those discussed above. The information given above is historic and should not be taken as any indication of future performance. It should not be assumed that recommendations made in the future will be profitable, or will equal, the performance of the securities discussed in this material. Upon request, the General Partner will provide to you a list of all the recommendations made by it within the past year. This document is not intended as and does not constitute an offer to sell any securities to any person or a solicitation of any person of any offer to purchase any securities. Such an offer or solicitation can only be made by the confidential Offering Circular of the Partnership. This information omits most of the information material to a decision whether to invest in the Partnership. No person should rely on any information in this document, but should rely exclusively on the Offering Circular in considering whether to invest in the Partnership. Disclosure: |
Original Posted on Harvest
Editor’s Note: The summary bullets for this article were chosen by Seeking Alpha editors.
Editor’s Note: This article discusses one or more securities that do not trade on a major U.S. exchange. Please be aware of the risks associated with these stocks.
Read the full article here

")
")
")
")
")
 Q2 2025 Earnings Call Transcript")
")
")
