


Earnings of Financial Institutions, Inc. (NASDAQ:FISI) will likely be lower this year because of the hit from fraudulent activity reported in the first quarter. Financial Institutions’ subsidiary bank, Five Star Bank, (not to be confused with the subsidiary of Five Star Bancorp, Five Star Bank, which operates in Northern California) was the victim of a deposit-account related incident earlier this year.
Further, earnings will suffer because the average margin will be lower this year compared to last year. On the other hand, low-single-digit loan growth will help earnings. Overall, I’m expecting the company to report earnings of $2.43 per share for 2024, down 23% year-over-year. The year-end target price suggests a high price upside from the current market price. Additionally, the company is offering a high dividend yield of over 6%. Based on the total expected return, I’m maintaining a buy rating on Financial Institutions, Inc.
Loan Growth to Improve After 1Q’s Disappointing Performance
Financial Institutions’ loan portfolio shrank by 0.3% during the first quarter of 2024. This performance is particularly disappointing considering the loan book has grown by double-digit rates for the last two years. I believe the loan portfolio’s performance can turn around soon because of the local economy as well as management’s initiatives.
Firstly, the company sold its insurance subsidiary, SDN Insurance, in April 2024, according to a press release. As mentioned in the conference call, FISI plans to deploy the proceeds from the sale into “our core banking business in the form of high-quality credit disciplined loan origination to drive higher yielding earning asset growth and support net interest margin expansion through the year.” The transaction has provided FISI with proceeds of $27.0 million; therefore, this sale could potentially increase the loan book size by 0.6%.
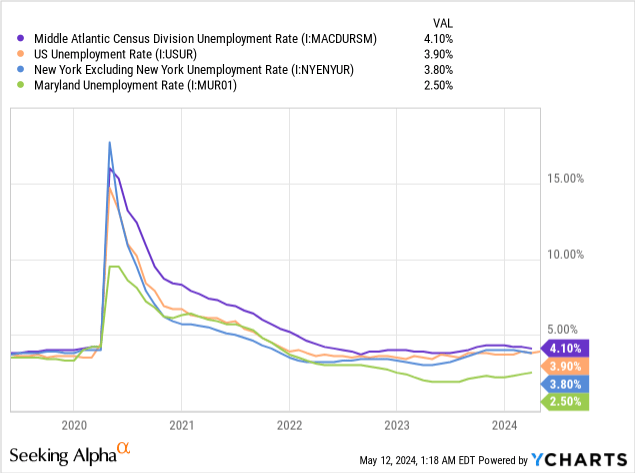
The regional economy can also support loan growth. Financial Institutions, Inc. mainly operates in Western and Central New York, with limited presence in the Mid-Atlantic region, particularly Maryland. As shown in the chart below, Maryland’s unemployment rate is currently much better than the national average, while New York’s unemployment rate (excluding New York City) is at par with the national average.

The management mentioned in the first quarter’s earnings presentation that it is expecting loan growth of 1%-3% for 2024. Based on the factors I mentioned above, I think loan growth for the year will fall towards the higher end of the management’s guidance. I’m expecting loan growth of 1% every quarter (4% annualized) through the end of 2025. Further, I’m expecting deposits to move in line with loans. The following table shows my balance sheet estimates.
| Financial Position | FY19 | FY20 | FY21 | FY22 | FY23 | FY24E | FY25E |
| Net Loans | 3,191 | 3,543 | 3,640 | 4,005 | 4,411 | 4,532 | 4,716 |
| Growth of Net Loans | 4.5% | 11.0% | 2.7% | 10.0% | 10.1% | 2.7% | 4.1% |
| Other Earning Assets | 781 | 904 | 1,390 | 1,144 | 1,037 | 1,084 | 1,106 |
| Deposits | 3,556 | 4,278 | 4,827 | 4,929 | 5,213 | 5,560 | 5,786 |
| Borrowings and Sub-Debt | 315 | 79 | 104 | 279 | 310 | 265 | 276 |
| Common equity | 422 | 451 | 488 | 388 | 438 | 451 | 462 |
| Book Value Per Share ($) | 26.3 | 28.1 | 30.6 | 25.1 | 28.3 | 29.0 | 29.7 |
| Tangible BVPS ($) | 21.6 | 23.5 | 25.9 | 20.4 | 23.6 | 24.3 | 25.1 |
| Source: SEC Filings, Author’s Estimates (In USD million unless otherwise specified) | |||||||
Expecting the Margin to Turnaround After the Recent Downtrend
Financial Institutions’ net interest margin remained unchanged in the first quarter of 2024 after declining for five consecutive quarters. The management mentioned in the conference call that it believes that the net interest margin has bottomed out during the first quarter. I also believe that the margin will stop declining because of the following two reasons:
- As discussed above, the sale and subsequent redirection of proceeds into loans will improve the asset mix and raise the net interest margin.
- The deterioration of the deposit mix will subside when the Fed funds rate starts declining. The deposit mix shifted away from non-interest-bearing deposits throughout last year as high rates incentivized depositors to shift their funds towards higher-paying accounts. The non-interest-bearing deposits shrank to 18.0% by the end of March 2024 from 20.8% at the end of March 2023.
However, the upcoming interest rate cuts can also pressurize the margin because of the balance sheet’s re-pricing characteristics. The asset re-pricing will outweigh deposit re-pricing, leading to pressure on the margin amid a falling interest rate environment. The results of the management’s interest-rate analysis given in the 10-Q filing show that a 100-basis point rate cut could reduce the net interest income by 2.27% over twelve months.
1Q 2024 10-Q Filing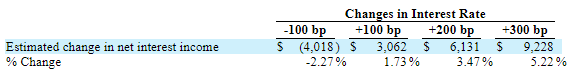

I’m expecting the Federal Reserve to cut the Fed funds rate by 25-50 basis points in the second half of this year and then 50 basis points in 2025. Considering my interest rate outlook and the discussion above, I’m anticipating the net interest margin to remain unchanged for another quarter and then rise by two basis points each quarter through the end of 2025. Despite the anticipated turnaround, the average margin for 2024 will likely be lower than the average margin for 2023 because the recovery this year will be slower than last year’s fall.
Earnings to Dip This Year Due to Fraud Already Reported
Earnings will likely be lower this year because of fraudulent activity caught during the first quarter. According to details given in the earnings release, Financial Institutions recorded an $18.4 million pre-tax loss for the fraud and approximately $660 thousand of legal and consulting expenses in the first quarter of 2024. Apart from the loss due to the fraudulent activity, earnings will likely be stable.
My balance sheet and net interest margin estimates lead to a net interest income estimate of $162 million for 2024, down 2.4% year-over-year, and $171 million for 2025, up 5.6% year-over-year. To project the non-interest income, non-interest expense, and income tax provision, I’m using the management’s guidance. The management made the following statements in the conference call.
- “We are now projecting non-interest expense of $33 million to $34 million per quarter for the remainder of 2024, again, reflecting the sale of SDN. This translates to full-year non-interest expense of $135 million to $136 million, excluding the $19 million of expense related to the fraud event recognized in the first quarter.”
- “Following our April 1, 2024, insurance transaction, we now expect recurring non-interest income between $8.5 million and $9 million per quarter or $36.5 million to $38 million for the full year.”
- “We now expect the 2024 effective tax rate to fall in the range of 13% to 15%.”
Further, the management mentioned in the presentation that it expected annual charge-offs to average assets’ ratio of 30-40 basis points.
Considering the assumptions above, I’m expecting Financial Institutions to report earnings of $2.43 per share for 2024, down 22.9% year-over-year. For 2025, I’m expecting earnings of $3.24 per share, up 33.3% year-over-year. The following table shows my income statement estimates.
| Income Statement | FY19 | FY20 | FY21 | FY22 | FY23 | FY24E | FY25E |
| Net interest income | 130 | 139 | 155 | 167 | 166 | 162 | 171 |
| Provision for loan losses | 8 | 27 | (8) | 13 | 14 | 4 | 13 |
| Non-interest income | 40 | 43 | 47 | 46 | 48 | 44 | 46 |
| Non-interest expense | 103 | 109 | 113 | 129 | 137 | 157 | 139 |
| Net income – Common Sh. | 47 | 37 | 76 | 55 | 49 | 38 | 50 |
| EPS – Diluted ($) | 2.96 | 2.30 | 4.78 | 3.56 | 3.15 | 2.43 | 3.24 |
| Source: SEC Filings, Earnings Releases, Author’s Estimates (In USD million unless otherwise specified) | |||||||
Risks Are Moderately High
Due to the following factors, I think Financial Institutions’ risk level is moderately high.
- The recent fraud (check-kiting) incident shows that Financial Institutions, Inc. is vulnerable to fraudulent activity. Something similar could happen again in the future.
- Loans for office properties made up a sizable 7% of total loans at the end of March 2024, as mentioned in the earnings presentation. This exposure puts FISI at risk from the emergent work-from-home culture.
- Even after exiting Pennsylvania’s automobile market earlier in 2024, FISI still has considerable exposure to consumer auto loans, which inherently carry high risk compared to other loan classes. The total Consumer Indirect portfolio had a net charge-off ratio of 1.28%, which is much higher than the total loan portfolio’s net charge-off ratio of 0.28%, as mentioned in the earnings presentation. Auto loans made up 21% of total loans at the end of March 2024.
FISI is Offering a Tempting Dividend Yield
Financial Institutions is offering a remarkably high dividend yield of 6.4%. Moreover, my earnings outlook above suggests that the dividend payout is secure. My earnings estimate and the current quarterly dividend of $0.30 per share suggest a payout ratio of 49.3%. Although this payout ratio is higher than the last five-year average of 34.5%, it is still easily affordable.
Moreover, there isn’t any threat of a dividend cut from regulatory requirements for capital. The company had a total risk-based capital ratio of 12.04% at the end of March 2024, which was higher than the minimum regulatory requirement of 10.0%.
Maintaining a Buy Rating
I’m using the historical price-to-tangible book (“P/TB”) and price-to-earnings (“P/E”) multiples to value Financial Institutions. The stock has traded at an average P/TB ratio of 1.10 in the past, as shown below.
| FY19 | FY20 | FY21 | FY22 | FY23 | Average | |
| T. Book Value per Share ($) | 21.6 | 23.5 | 25.9 | 20.4 | 23.6 | |
| Average Market Price ($) | 29.2 | 20.0 | 30.1 | 27.6 | 18.9 | |
| Historical P/TB | 1.35x | 0.85x | 1.16x | 1.36x | 0.80x | 1.10x |
| Source: Company Financials, Yahoo Finance, Author’s Estimates | ||||||
Multiplying the average P/TB multiple with the forecast tangible book value per share of $24.3 gives a target price of $26.9 for the end of 2024. This price target implies a 42.4% upside from the May 10 closing price. The following table shows the sensitivity of the target price to the P/TB ratio.
| P/TB Multiple | 0.90x | 1.00x | 1.10x | 1.20x | 1.30x |
| TBVPS – Dec 2024 ($) | 24.3 | 24.3 | 24.3 | 24.3 | 24.3 |
| Target Price ($) | 22.0 | 24.4 | 26.9 | 29.3 | 31.7 |
| Market Price ($) | 18.9 | 18.9 | 18.9 | 18.9 | 18.9 |
| Upside/(Downside) | 16.6% | 29.5% | 42.4% | 55.3% | 68.2% |
| Source: Author’s Estimates |
The stock has traded at an average P/E ratio of around 7.7x in the past, as shown below.
| FY19 | FY20 | FY21 | FY22 | FY23 | Average | |
| Earnings per Share ($) | 2.96 | 2.30 | 4.78 | 3.56 | 3.15 | |
| Average Market Price ($) | 29.2 | 20.0 | 30.1 | 27.6 | 18.9 | |
| Historical P/E | 9.9x | 8.7x | 6.3x | 7.7x | 6.0x | 7.7x |
| Source: Company Financials, Yahoo Finance, Author’s Estimates | ||||||
Multiplying the average P/E multiple with the forecast earnings per share of $2.43 gives a target price of $18.8 for the end of 2024. This price target implies a 0.5% downside from the May 10 closing price. The following table shows the sensitivity of the target price to the P/E ratio.
| P/E Multiple | 5.7x | 6.7x | 7.7x | 8.7x | 9.7x |
| EPS 2024 ($) | 2.43 | 2.43 | 2.43 | 2.43 | 2.43 |
| Target Price ($) | 13.9 | 16.4 | 18.8 | 21.2 | 23.6 |
| Market Price ($) | 18.9 | 18.9 | 18.9 | 18.9 | 18.9 |
| Upside/(Downside) | (26.2)% | (13.3)% | (0.5)% | 12.4% | 25.3% |
| Source: Author’s Estimates |
Equally weighting the target prices from the two valuation methods gives a combined target price of $22.8, which implies a 21.0% upside from the current market price. Adding the forward dividend yield gives a total expected return of 27.3%.
In my last report, which was published back in April 2023, I adopted a buy rating with a December 2023 target price of $26.9. Based on my updated total expected return, I’m maintaining a buy rating on Financial Institutions.
Read the full article here


 (NYSE:SNOW)")
")

 Morgan Stanley Technology, Media & Telecom Conference (Transcript)")


