


")


As we all know, the Federal Reserve has raised rates to 5.00-5.25% recently in a monetary tightening effort to slow down inflation. When the interest rate is higher, we are more tempted to invest in a high yield savings account to get that slice of that cake. However, the window of opportunity will soon be closing. As inflation rates fall, the Fed will eventually scale back interest rates, with an eventual goal of a paltry 2.00-2.50% rate.
This will certainly leave investors looking for alternative high yield investments. The BDC (business development company) sector comes to mind, where the investment return is primarily in the dividend yield, which is normally in the 8-10% range. However, picking BDCs for long-term holds has a flavor of stepping into a minefield because not all BDCs are created equal and run equally.
In this article, I want to focus on Sixth Street Specialty Lending, Inc., or known by the ticker symbol (NYSE:TSLX). I will illuminate the six critical areas that an analyst should look at to evaluate the investment potential of a BDC:
- Management & incentive fee alignment.
- Debt to equity ratios – conservative is better.
- Cost of leverage – the lower, the better.
- Percentage of assets that are senior secured & floating rate.
- Credit quality – what I call the “equity charge-off rate”.
- Diversification & concentration in non-cyclical industries.
About BDCs & The Business Model
Business development companies often invest in middle-market business debt. These are companies that are too small to make offerings on the bond markets but too large for a typical business loan. The typical loan that a BDC makes yields about prime plus 2 – 3%. On the liabilities side, BDCs use leverage to earn more, and the debt that BDCs incur is typically in the form of a bond, note, or baby bond.
By law, BDCs are required to stay below a debt-to-equity ratio of 2. However, by choice, most BDCs remain close to 1. Additionally, a BDC is required by law to pay at least 90% of its taxable income in dividends. This means that BDCs have very limited ability to retain earnings and make up for credit losses. This means that BDCs with poor credit quality will tend to see their NAV (net asset value) decay over time.
BDCs are run by management teams, which must be compensated. This means that the management and incentive fee schedules should be in alignment with shareholder interests in a desirable investment.
Let’s begin our deep dive into TSLX!
Management & Incentive Fee Alignment
I quote the February 15, 2024, 10-K:
The Management Fee is calculated at an annual rate of 1.5% based on the average value of our gross assets calculated using the values at the end of the two most recently completed calendar quarters, adjusted for any share issuances or repurchases during the period. The Management Fee is payable quarterly in arrears.
The management fee is simple: 1.5% of assets each year. This is a very typical rate across the BDC universe.
Then the incentive fee: this one is less straightforward. The “hurdle rate” on returns on assets, after which management receives incentive fees of 1.5% quarterly, which works out to 6% annually. This means that the management is incentivized to make sure that the asset portfolio overall yields at least 6%.
Management keeps 100% of net investment income between the 1.5% quarterly and 1.82% quarterly yield on the assets, and then management keeps 17.5% of net investment income that is above the 1.82% quarterly yield on assets. Note that 1.82% quarterly works out to 7.28% annualized.
The incentive fee is designed to encourage management to take an appropriate amount of risk: the incentive fee begins at a 6% asset portfolio yield, and ends at 7.28%. For returns beyond 7.28%, management keeps 17.5% of that. This means that there is less incentive for management to reach beyond an asset portfolio yield of 7.28%.
Note that the prime rate is currently 8.50%, so the typical asset on a BDC’s books yields about 10.50-11.50%. In general, the management fee and incentive fee structures are in alignment with shareholder interests in my opinion.
Balance Sheet Leverage
The figures below were extracted from various 10-K filings. Figures are in millions.
| FY Year End | Total Liabilities | Total Equity | Debt to Equity |
| 2023 | 1,847 | 1,496 | 1.235 |
| 2022 | 1,495 | 1,342 | 1.114 |
| 2021 | 1,276 | 1,276 | 1.000 |
| 2020 | 1,177 | 1,161 | 1.014 |
| 2019 | 1,162 | 1,119 | 1.038 |
| 2018 | 667 | 1,063 | 0.627 |
| 2017 | 751 | 969 | 0.775 |
| 2016 | 723 | 952 | 0.759 |
| 2015 | 686 | 821 | 0.836 |
Around late 2018, the regulation regarding leverage of BDCs changed, raising the allowable debt-to-equity ratio from 1 to 2. This allowed TSLX to slowly creep up its balance sheet leverage levels over time. This is a somewhat negative development, as it increases the negative impact that asset losses have on the NAV. This is one red mark against TSLX.
Asset Portfolio Seniority & Rate Structures
As of December 31, 2023, the asset portfolio had the following composition, all figures in millions:
| Amortized Cost | Fair Value | |
| First Lien Debt | 2,956.1 | 2,996.2 |
| Second Lien Debt | 51.4 | 36.0 |
| Mezzanine Debt | 38.0 | 39.5 |
| Equity & Other | 152.6 | 155.6 |
| Structured Credit | 52.9 | 55.8 |
Substantially all of the investment portfolios in TSLX are first-lien debt. This is a good sign – it shows that even if management is inching up the leverage, the assets are formally the most conservative possible. Check mark. Next, we look at the rate structure and call protection. I’ll directly quote the 2023 10-K:
We seek to mitigate non-credit-related risk on our returns in several ways, including call protection provisions to protect future interest income.
As of December 31, 2023, we had call protection on 75.1% of our debt investments based on fair value, with weighted average call prices of 106.5% for the first year, 103.2% for the second year and 101.0% for the third year, in each case from the date of the initial investment.
As of December 31, 2023, 99.7% of our debt investments based on fair value bore interest at floating rates, with 100% of these subject to interest rate floors, which we believe helps act as a portfolio-wide hedge against inflation.
Substantially all of the asset portfolio is floating rate. This matches with the liabilities, which are each fixed rate with an interest rate swap attached that converts the rate to a floating rate. Each interest rate swap corresponds with a liability. The following was taken from the May 2024 quarterly filing 10-Q:
|
Company Receives |
Company Pays |
Maturity Date | Notional Amount (Thousands) | |
| Interest Rate Swap | SOFR + 2.54% | 3.875% | 11/1/2024 | 2,500 |
| Interest Rate Swap | 3.875% | SOFR + 2.51% | 11/1/2024 | 300,000 |
| Interest Rate Swap | 3.875% | SOFR + 2.72% | 11/1/2024 | 50,000 |
| Interest Rate Swap | 2.50% | SOFR + 2.17% | 8/1/2026 | 300,000 |
| Interest Rate Swap | 6.95% | SOFR + 2.99% | 8/14/2028 | 300,000 |
| Total Hedge Accounting Swaps | 925,500 |
The overall effect is that both assets and liabilities are substantially all floating rate. This means that regardless of the interest rate fluctuations, TSLX earns a generally static interest margin between its assets and liabilities, a good sign, as floating rate investments also have less value volatility as a function of changes in the discount rate.
Credit Quality & Underwriting Results
BDCs report an account called “Net realized and unrealized gains (losses) on investments, foreign currency, and other transactions”. This account, along with the net assets, provides a quick and dirty way to assess a BDC’s underwriting, where I compute what I will call the “equity appreciation (depreciation) ratio” by dividing net realized and unrealized losses by net assets. The figures (in millions) for the table below were taken from past 10-K filings:
| Year Ended | Net Realized And Unrealized Gains (Losses) | Total Equity | Equity Appreciation (Depreciation) Ratio |
| 2023 | 26 | 1,496 | 1.738% |
| 2022 | (58) | 1,342 | (4.322%) |
| 2021 | 69 | 1,276 | 5.408% |
| 2020 | 31 | 1,161 | 2.670% |
| 2019 | 26 | 1,119 | 2.324% |
| 2018 | (25) | 1,063 | (2.352%) |
| 2017 | (9) | 969 | (0.929%) |
| 2016 | 30 | 952 | 3.151% |
| 2015 | (32) | 821 | (3.898%) |
| 2014 | (19) | 835 | (2.275%) |
The average equity appreciation (depreciation) ratio for 2014 – 2023 is equal to 0.151% per year. This is solid evidence that TSLX is capable of preserving net asset value over the long run, which means that the earning power behind each share stays roughly constant over time. Stability is a good thing. Check mark.
Cost Of Leverage
What TSLX avoids paying in interest expenses goes to the shareholder. As prospective investors, we want to root for the lowest possible cost of liabilities. Below is a quick estimate of the cost of liabilities for TSLX and a comparison with the average AAA corporate bond yield.
| Year | Interest Expense | Total Liabilities | Cost of Liabilities | Average AAA Bond Yield (FRED) |
| 2023 | 134 | 1,847 | 7.255% | 4.81% |
| 2022 | 63 | 1,495 | 4.214% | 4.07% |
| 2021 | 39 | 1,276 | 3.056% | 2.70% |
| 2020 | 39 | 1,177 | 3.313% | 2.48% |
| 2019 | 49 | 1,162 | 4.217% | 3.39% |
| 2018 | 43 | 667 | 6.447% | 3.93% |
| 2017 | 27 | 751 | 3.595% | 3.74% |
| 2016 | 23 | 723 | 3.181% | 3.67% |
| 2015 | 22 | 686 | 3.207% | 3.89% |
As a result of its interest rate swaps that swapped fixed for floating rates, the interest expense has soared in 2023 because of the Fed’s rate hikes. There are other BDCs with lower interest expenses, most notably Ares Capital (ARCC), which consistently has a lower cost of liabilities than the AAA bond yield.
However, the Fed rate hikes were in response to the inflation caused by the response to the COVID pandemic, and we are now facing the prospect of a gradual rate decrease from 5.00-5.25% down to 2.00-2.50%. Eventually, TSLX’s interest expenses should moderate a bit.
Portfolio Diversified By Industry
As prospective investors, we want to see that the asset portfolio is diversified and heavily tilted away from cyclical industries in favor of non-cyclical industries. This is because we don’t want to be burned by excessive concentration in a downswing of a cyclical industry, per the experience of 2014-2015 during the oil price collapse caused by the overproduction of shale oil. The table below, extracted from the 2023 10-K filing, shows the allocation of the investment portfolio by industry in TSLX:
TSLX 2023 10-K Filing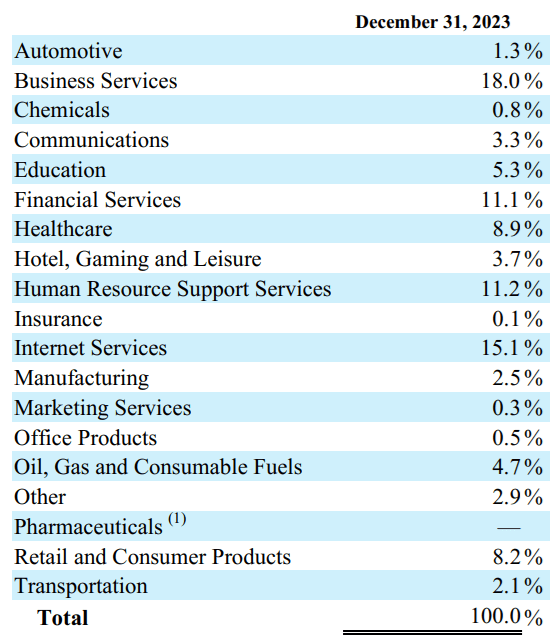

Chemicals and oil & gas form 5% of the portfolio. There are BDCs with even smaller concentrations in these industries, such as ARCC, whose number is about 2%. Still, the allocation to cyclical industries is quite small, so I would still say that TSLX is heavily tilted away from cyclicals.
Conclusions
Out of the six areas we examined, five of them are highly attractive traits, with just one exception.
- The fee structure aligns management with shareholders.
- Evidence of a slight reaching for more leverage – not a good look (!)
- Substantially all of the investments are first-lien debt instruments.
- Capable of preserving net asset value over 2014-2023.
- The cost of leverage is dictated by the terms of the interest rate swaps that swap away fixed rates in exchange for floating rates.
- The asset portfolio is diversified in non-cyclical industries and has only a small allocation to chemicals & oil & gas.
Overall, I would rate TSLX a buy for a long-term hold, with the caveat that the balance sheet leverage needs to be monitored carefully to make sure that the BDC stays within your risk tolerance.
Read the full article here

")

 (NYSE:SNOW)")
")

 Morgan Stanley Technology, Media & Telecom Conference (Transcript)")


